skip to main | skip to sidebar

John's Maps

Friday, August 1, 2008

Isoline Maps-Hawaii Rainfall

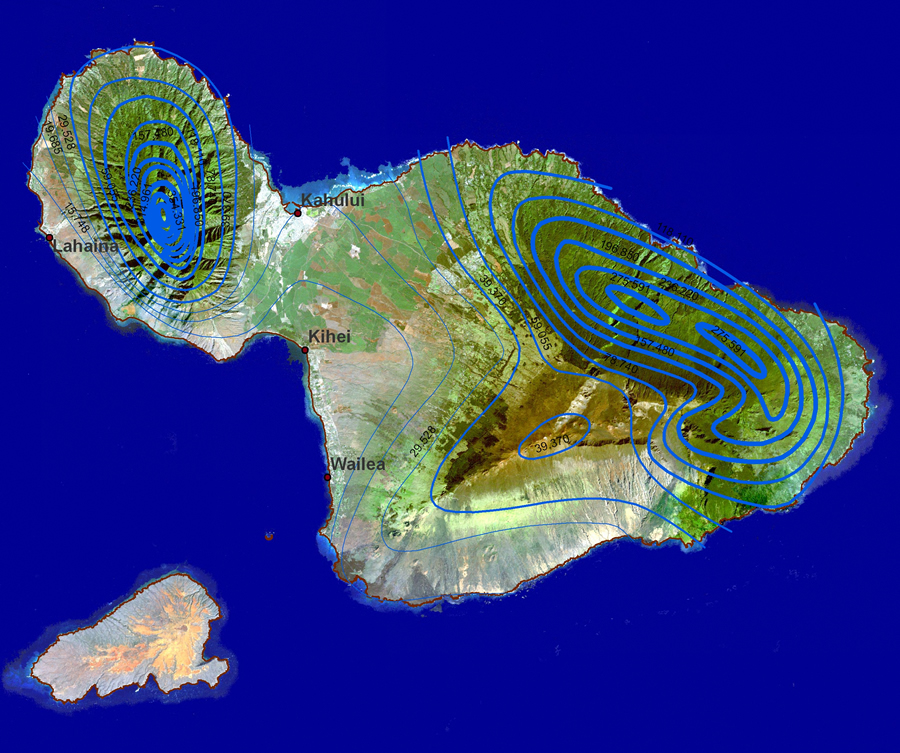
An isoline map is a map with continuous lines joining points of the same value. Isoline mapping is used to interpret the information on some thematic maps. Depicted here is the rainfall on one of the islands of Hawaii.

Posted by John Foster at 5:44 AM

No comments:

Post a Comment

Newer Post Older Post Home
Subscribe to: Post Comments (Atom)

Blog Archive

  • ▼  2008 (46)
    • ▼  August (45)
      • Multivariate Map
      • Bilateral Graph
      • Bivariate Chloropleth Map
      • Digital Line Graphs
      • Box plots
      • Histogram
      • Parallel Coordinate System
      • Traingle Plot
      • Windrose
      • Climograph
      • Population Profile
      • Scatter Plots
      • Index Value Plot
      • Lorenz Curve
      • Continuously variable proportional circle map
      • DOQQ
      • DEM
      • Stem and leaft plot
      • Similarity Matrix
      • A Correlation matrix describes correlation among v...
      • Star Plots
      • Digital Raster Graphics
      • ISOHYETS-Rainfall
      • ISOTACHS
      • ISOBARS-Wheather
      • LIDAR-Manhattan
      • Doplar Radar-Tallahassee
      • Black and white aerial photo
      • Infrared Aerial Photos
      • Cartographic animation-Wind Velocities
      • Statistical Map-The Brain
      • Cartograms-Size of country based on population
      • Flow Maps-New Orleans Trucking Flow
      • Isoline Maps-Hawaii Rainfall
      • Proportional Circle Maps
      • Chloropleth Map
      • DOT Distribution Map
      • Propaganda Map-German advances WWII
      • Hypsometric Map
      • PLSS Map
      • Cadastral Map
      • Thematic Map
      • Topo map
      • Planemetric Maps
      • Mental Maps
    • ►  June (1)

About Me

John Foster
View my complete profile